The SQE four years on – facts and figures
29 January 2026
Executive summary
The Solicitors Regulation Authority has published data showing who is sitting the Solicitors Qualifying Examination (SQE) and offering new insights on how candidates are performing.
The data is drawn from almost four years of SQE results. It covers eight SQE1 and 12 SQE2 assessments taken between November 2021 and July 2025, and more than 30,000 candidates assessed in 50 countries.
While the standard remains the same for each sitting, the pass rate (the percentage of the cohort that passes) varies, because the performance of the candidate cohorts varies.
The pass rates for candidates sitting SQE1 for the first time have ranged from 46% to 60%. Of all candidates who have attempted SQE1 – including those who have had multiple attempts – 19,281 (66%) candidates have now passed.
The pass rates for candidates sitting SQE2 for the first time have ranged from 69% to 84%. Of all candidates who have attempted SQE2- including those who have had multiple attempts – 10,718 (85%) candidates have now passed.
Kaplan, the SQE assessment provider, has undertaken and published a multivariate analysis. This enables deeper insights, as it considers the impact of a range of factors on candidate performance.
The key findings from the report are summarised below.
Main factors that have an impact on candidate performance
The analysis shows that most of the variance in candidates' SQE scores cannot be explained by a candidate's demographic profile, either alone or in combination. A candidate's demographic profile includes their age, ethnicity, gender, disability, social background and education. The variance is likely explained by other factors where data is not captured, such as motivation, aptitude, ability and study time.
The two factors on which we have data that have the most impact on performance for SQE1 relate to university ranking and past academic achievement. This accounts for around 23% of the variance, with the ranking of the university a candidate attended accounting for 12% of the variance and the classification of the degree they achieved for 11%. For SQE2 candidates, SQE1 performance and university ranking explain about 30% of the variance.
Ethnicity
The SQE is attracting more ethnically diverse candidates than the UK working population. For instance, around 28% of candidates are Asian or British-Asian, compared to 10% of the working population. Seven per cent of candidates are Black or Black-British, compared to 3% of the working population.
There is a long-standing issue in legal assessments, as well as other professional and academic assessments: the overall pass rate for White candidates is higher than the overall pass rate for candidates of other ethnicities. Research we commissioned from the University of Exeter before the first SQE assessments were taken showed there are multiple, complex factors combining to cause the difference.
Kaplan's multivariate analysis shows that 8% of variance in SQE1 scores can be linked to ethnicity. This drops to 4% for SQE2. The variance recorded here only explains a small proportion of the difference in overall pass rates, suggesting a more complex explanation. The Kaplan study records 67% of variance as unexplained by the data recorded. It may be the cases that other factors, such as how a candidate prepares for the exam, have more impact than demographic characteristics.
Social mobility and disability
We have data that gives an indication of candidates' socio-economic backgrounds, such as the type of school they attended and their parents' occupation and education. It shows that there are candidates from all backgrounds, with a fairly even spread between privileged and less-privileged backgrounds. Around 37% of candidates are from less privileged backgrounds.
When other factors are taken into account, socio-economic background appears to have little impact on performance. For instance, the impact on SQE1 and SQE2 scores of a parent's education (0.3%) or occupation (0.1%) alone is negligible.
The data also shows that candidates who declare a disability perform at least as well as other candidates on the SQE. This is not the case with the previous qualification route – the Legal Practice Course (LPC).
Solicitor apprenticeships
Solicitor apprenticeships offer an alternative, 'earn-as-you-learn' route to qualification. More than 800 apprentices have passed SQE, with the data showing these candidates are more likely to come from less privileged socio-economic backgrounds than SQE candidates as a whole.
Solicitor apprentices have generally performed well in SQE assessments compared to other candidates. The overall solicitor apprentice pass rates have been around 71% for SQE1 and 93% for SQE2, compared with 66% and 85% for the whole cohort. Overall, they have scored higher in all but one SQE2 sitting and better in most SQE1 sittings.
The data also shows that there is little difference in performance between 'school leaver' apprentices and graduate apprentices. The first will typically take six years to qualify. Graduate apprenticeships typically last two to three years.
Other insights
The data shows that some candidates tend to perform less well than others including:
- Resitting candidates – those who fail their first attempt and choose to re-sit generally have lower pass rates than candidates sitting for the first. Typically, around 20% of those who resit SQE1 pass.
- Qualified lawyers – those who take the SQE who have previously trained or qualified as a lawyer either in the UK or overseas – have lower pass rates, in general, on both SQE1 and SQE2. The same is true of those whose first language is not English – these candidates have an overall SQE1 pass rate of 47%, compared to 56% for candidates for whom English is their first language. For SQE2, the overall pass rate for candidates for whom English is not their first language is 63%; the pass rate for those with English as their first language is 81%.
- LPC graduates – those who have completed the LPC, who can qualify as a solicitor by taking SQE2 – generally have lower pass rates. This may reflect the fact that the LPC focuses on testing a candidate's readiness to start a training contract, whereas the SQE tests whether a candidate is ready to practise as a solicitor, and so is more demanding. The data shows that candidates who have completed the LPC cannot rely on their studies for that qualification to pass SQE2.
Neurodivergent candidates
We have heard concerns that neurodivergent candidates are disadvantaged when taking the SQE. Kaplan has analysed the data from all SQE1 and SQE2 sittings taken between September 2024 and July 2025. It has looked at the data for candidates attempting the assessments for the first time who had a reasonable adjustment for a disclosed neurodivergent condition. A report on the analysis has been published (PDF 4 pages, 401KB).
Across the sittings, 5.6% of candidates assessed in this period had a reasonable adjustment plan for a neurodivergent condition. Overall, these candidates achieved slightly higher scores and pass rates than other candidates, providing assurance that neurodivergent candidates are not disadvantaged in the assessment.
The first SQE assessments were taken four years ago, in November 2021. Results have been released for eight SQE1 sittings and 12 SQE2 sittings.
While the standard remains the same for each sitting, the pass rate (the percentage of the cohort that passes) varies, because the performance of the candidate cohorts varies.
- The pass rates for SQE1 candidates sitting for the first time have ranged from 46% to 60%. Of all candidates who have attempted SQE1 – including those who have had multiple attempts – 19,281 (66%) candidates have now passed.
- The pass rates for SQE2 candidates sitting for the first time have ranged from 69% to 84%. Of all candidates who have attempted SQE2- including those who have had multiple attempts – 10,718 (85%) candidates have now passed.
The annual SQE reports and the statistical reports published after each sitting provide good insight into who is taking and who is passing the SQE. We have looked across the data and undertaken additional analyses to provide a fuller picture. This shows:
- SQE candidates are very diverse by ethnicity and socio-economic background
- candidates' performance varies by their characteristic and background, with their degree classification and university ranking having the greatest identifiable impact
- solicitor apprenticeships in England are supporting social mobility, and solicitor apprentices are performing particularly well in their assessments with higher pass rates than the overall cohort
- who have a reasonable adjustment because of their neuro-diversity are performing well in the assessments
- the characteristics of the candidate cohort of any sitting affect the pass-rate for that sitting
- the SQE training market has responded well, providing a wide range of choices for candidates.
The SQE entry cohort, which includes candidates living in the UK and in other countries, is more ethnically diverse than the UK population, when compared with the 2021 census data. It is also more diverse than the solicitor profession.
The SQE data in the table below is drawn from a report on candidate characteristics and factors that influence performance on the SQE. It uses data created between November 2021 and January 2025.
| Asian/Asian British % | Black/Black British % | Mixed or Multiple % | Other % | White % | Undeclared % | |
|---|---|---|---|---|---|---|
| SQE | 28.4 | 6.6 | 4.9 | 6.1 | 47 | 7 |
| 2021 census working age population | 10.1 | 4.4 | 2.5 | 2.3 | 80.7 | NA |
| Lawyers in UK firms | 12 | 3 | 3 | 1 | 77 | 4 |
Candidates' socio-economic background has been determined by Kaplan using information candidates have provided on:
- whether either parent attended university
- the occupation of the main household earner when the candidate was aged about 14 years
- the type of secondary school attended.
Candidates have been allocated to one of seven socio-economic groups with one being the lowest socio-economic rank and seven the highest. SQE candidates are drawn from across the range of socio-economic groups, as shown in the chart below.
| Group 1 | 14% |
|---|---|
| Group 2 | 10.2% |
| Group 3 | 13.8% |
| Group 4 | 8.2% |
| Group 5 | 23.2% |
| Group 6 | 14.1% |
| Group 7 | 16.6% |
Of the 31,582 candidates to whom SQE1 and/or SQE2 results have been issued, 63% were female, 35% male and 2% selected the 'prefer not to say' or 'other' option.
64% of female and 68% of male candidates who have taken SQE1 have passed. For SQE2, 86% of female and 83% of male candidates who have taken the assessment have passed.
The pass rate for an assessment is the percentage of candidates who took the assessment who passed.
Of all candidates who have attempted SQE1 - including those who have had multiple attempts - 19,281 (66%) candidates have now passed.
Of all candidates who have attempted SQE2 - including those who have had multiple attempts - 10,718 (85%) candidates have now passed.
The table below breaks down the overall pass rates by the number of attempts. It shows, for example, that of all candidates who have attempted SQE1, 54.3% passed on their first attempt. The corresponding figure for SQE2 is 79.6%.
Of all candidates who have passed SQE1, 82.1% passed on their first attempt. The corresponding figure for SQE2 is 94.2%.
| All Candidates | Passing Candidates | |||
|---|---|---|---|---|
| Attempt | SQE1 | SQE2 | SQE1 | SQE2 |
| 1 | 54.3% | 79.6% | 82.1% | 94.2% |
| 2 | 9.9% | 4.6% | 15% | 5.5% |
| 3 | 1.9% | 0.3% | 2.9% | 0.3% |
| Total proportion who have passed | 66.1% | 84.5% | 100% | 100% |
The statistical reports also show candidate pass rates by a range of candidate characteristics and backgrounds, including ethnicity, sex, degree classification, school type attended, age. The data is presented characteristic by characteristic – it is not combined to show combinations of characteristics.
The data shows that:
- White candidates have generally performed better than candidates of all other ethnicities, in both SQE1 and SQE2
- male candidates have generally performed better than female candidates in SQE1 with the position reversed in SQE2
- candidates who disclosed they have a disability generally perform at least as well in both SQE1 and SQE2 as candidates who did not disclose a disability
- candidates from lower socio-economic backgrounds generally performed less well than candidates from higher socio-economic backgrounds
- candidates with higher degree classifications generally performed better than candidates with lower degree classifications.
Kaplan has undertaken a multivariate analysis to understand, when characteristics are considered in the round, how much of the difference in candidates' performance is associated with any one characteristic. The methodology it has used is explained in its report. This multivariate analysis shows that the rank of the university attended by a candidate and their degree classification together explain about 22% of the variance in candidates' SQE1 scores - 11.9% for university rank and 10.6% for degree classification.
Candidates who undertook degrees at higher ranking universities and candidates who attained a higher-class degree generally performed better than those attending a lower ranking university and/or who attained a lower class-degree.
Generally, a candidate's ethnic group alone explains 7.6% of the variance in SQE1 scores. This means that 92.4% of the variance in the scores of candidates of different ethnicities does not appear to be directly attributed to their ethnicity.
When other factors are taken into account, candidates' socio-economic background alone accounts for very little of the variance seen in SQE1 scores - 0.3% for parents' education and 0.1% for household earner's occupation.
Most of the variance in candidates' scores cannot be explained by the data we have on their characteristics or backgrounds, either alone or in combination. It is likely to be explained by factors we cannot measure such as motivation, aptitude, study time.
For SQE2 (which can only be taken once SQE1 has been passed), 23.5% of the variance in candidates' scores can be explained by their SQE1 score. A candidate who scored higher in SQE1 is more likely to pass SQE2 than a candidate who scored lower in SQE1 (although still high enough to pass). Ethnicity alone appears to account for 4.2% of the variance in candidates' SQE2 scores.
Solicitor apprenticeships, which are available in England, are becoming increasingly popular. Solicitor apprentices work for four days a week in legal practice and study on the fifth day. They must pass both SQE1 and SQE2 to qualify as solicitors.
The total number of apprentices who have attempted SQE1 on one or more occasion is 1,896. Of these, 1,377 have passed – a pass rate of 70.5%. The total number of apprentices who have attempted SQE2 on one or more occasion and to whom results have been released is 887. Of these, 824 have passed, a pass rate of 92.9%.
The solicitor apprenticeship was designed with school leavers in mind. A school leaver will typically take six years to complete their apprenticeship and qualify as a solicitor. This is about the same time taken by someone who goes from school to university and then takes the SQE. Many will be awarded a law degree during their apprenticeship, although this is not a requirement.
An alternative format has emerged, known as the graduate apprenticeship. This is followed by individuals who already hold a degree when they start their apprenticeship. It is typically completed in two to three years. A change in government policy took effect in January 2026. This means that funding for apprentices is mainly limited to those aged 21 or under when they start their apprenticeship.
Headline data on solicitor apprentice pass rates is included in the annual and statistical reports. This has shown apprentices have generally performed well in their assessments, when compared with the wider cohort. A more detailed analysis of the make-up of the solicitor apprentice cohort and their performance has now been undertaken.
This analysis shows that, when compared with the wider SQE cohort, solicitor apprentices:
- are more likely to come from lower socio-economic backgrounds
- are more likely to be White
- are more likely to be female.
It also shows there is little difference in the SQE performance between graduate and non-graduate apprentices.
Most candidates have to pass both SQE1 and SQE2 before they can be admitted as a solicitor, however there are exceptions. Some lawyers qualified in other jurisdictions are exempt from SQE2. Candidates who have passed the LPC and are qualifying through the transitional provisions do not have to take SQE1. These two types of candidates were prominent in the early sittings.
A candidate can attempt each of FLK1, FLK2 and SQE2 three times. A candidate must pass all the SQE assessments within six years. In the first sittings, all candidates were, naturally, taking the assessments for the first time. In later sittings, the proportion of re-sitting candidates has increased. For the July 2025 SQE1 sitting, the proportion of candidates re-sitting either or both of FLK1 and FLK2 was the highest yet.
Fluctuations in the pass rates seen in different sittings can be explained, at least in part, by the make-up of the cohorts is illustrated in re-sitting candidates section.
On its introduction, the SQE became the only route for qualified lawyers to be admitted as a solicitor in England and Wales. The previous route, the Qualified Lawyers Transfer Scheme (QLTS), was withdrawn.
The opportunity to take the written SQE assessments in test centres across the world makes qualification as a solicitor in England and Wales more accessible for some. The SQE1 and SQE2 written assessments have been taken in 50 different countries so far. The SQE2 oral assessments can only be taken in England and Wales.
Qualified lawyers and candidates whose first language is not English have generally had lower pass rates than the wider cohort. This is the case for both SQE1 and SQE2. For example, for the sittings in 2023/2024, the pass rates were:
| First language | SQE1 | SQE2 |
|---|---|---|
| English | 56% | 81% |
| Other | 47% | 63% |
The October 2023 SQE2 sitting was the last opportunity for qualified lawyers who had passed the functioning knowledge assessment of the QLTS to qualify under transitional provisions. They had to pass SQE2 but not SQE1.
In that sitting, 34% of candidates were qualified lawyers, the highest of any SQE2 sitting. The overall pass rate (including re-sitting candidates) for that sitting was 64% – the lowest of any SQE2 sitting to date. However, the pass rate for candidates who were not qualified lawyers was 80%; the pass rate for qualified lawyers was 49%.
The introduction of the SQE has also provided a route to qualification for many LPC graduates whose ambition to qualify had been frustrated because they could not secure a period of recognised training. Instead, they can now pass SQE2 and undertake two years' qualifying work experience. So far, around 900 LPC graduates have successfully taken this route to qualification.
Although the SQE has provided a welcome opportunity for these individuals, SQE2 has proved challenging for some. The demands of the LPC and the SQE are different. The LPC was designed to assess individuals' readiness to start a training contract. The SQE, in contrast, is designed to assess individuals' readiness to start practising as a solicitor – in other words, the SQE is, by its nature more demanding than the LPC.
The SQE2 pass rates of LPC graduates have been lower than those of the wider cohort. Cohorts with a higher proportion of LPC graduates tend to have lower overall pass rates. We have reminded LPC graduates that they need to understand the SQE is more demanding than the LPC and prepare accordingly.
| SQE2 sitting | Pass rate of candidates who had taken SQE1 | Pass rate of candidates who had not taken SQE1 |
|---|---|---|
| April 2024 | 83% | 36% |
| July 2024 | 80% | 44% |
| October 2024 | 85% | 62% |
| January 2025 | 79% | 50% |
| April 2025 | 84% | 48% |
| July 2025 | 81% | 47% |
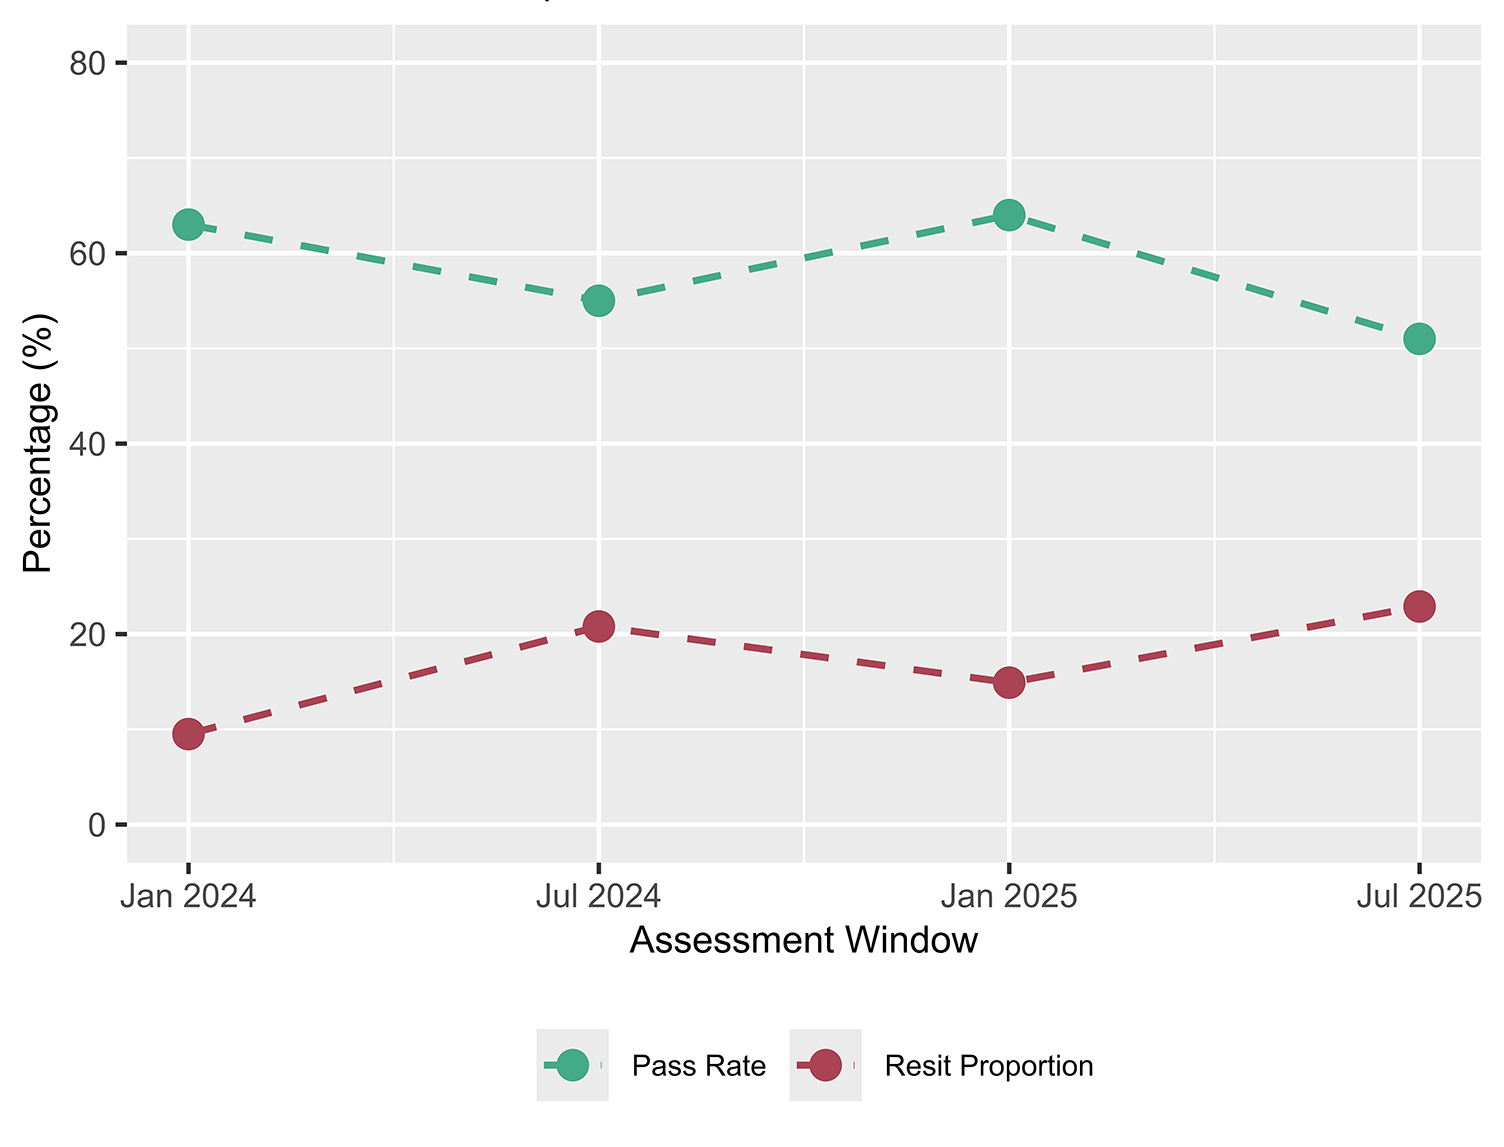
Candidates who fail an SQE assessment and re-sit generally have lower pass rates than candidates sitting for the first time. The July 2025 SQE1 sitting had the highest proportion of re-sitting candidates seen to date. It also had the lowest pass rate. The charts below, extracted from a wider paper on SQE1 results show the relationship between pass rates for recent sittings and the proportion of re-sitting candidates in each of FLK1 and FLK2.
FLK 1 pass rate and proportion of resitters over time
| January 2024 | July 2024 | January 2025 | July 2025 | |
|---|---|---|---|---|
| Pass rate (all candidates) | 63% | 55% | 64% | 51% |
| Resitter % | 9% | 21% | 10% | 23% |
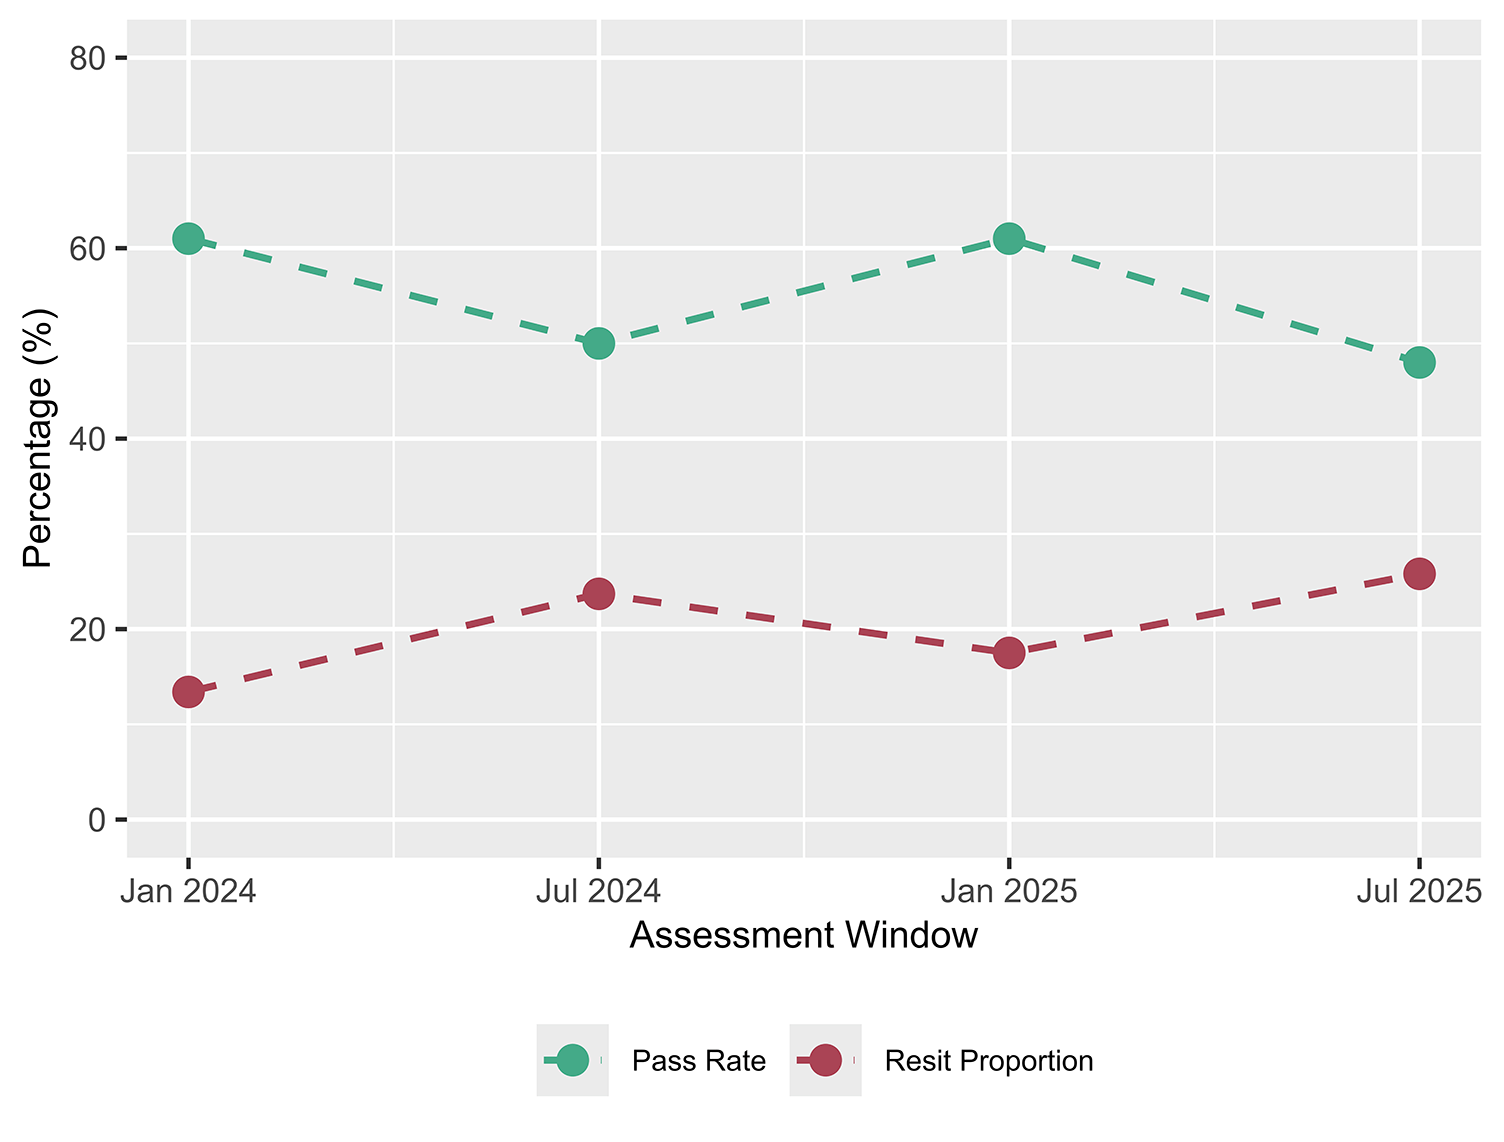
FLK 2 pass rate and proportion of resitters over time
| January 2024 | July 2024 | January 2025 | July 2025 | |
|---|---|---|---|---|
| Pass rate (all candidates) | 61% | 50% | 61% | 48% |
| Resitter % | 13% | 24% | 10% | 26% |
Of all candidates who have taken SQE1, 9.9% passed on their second attempt and 1.9% on their third attempt.
Of all candidates who have taken SQE2, 4.2% passed on their second attempt and 0.2% on their third attempt.
The low pass rate for the July 2025 SQE1 sitting was not explained entirely by the proportion of re-sitting candidates – the pass rate for candidates sitting for the first time was also lower than seen before. However, we know the general July 2025 SQE1 cohort (both first time sitters and re-sitters) was weaker than that of recent sittings, because we can compare candidates' performance on common questions. The analysis of the performance on the common questions in the July 2025 assessment showed that the July 2025 cohort was weaker than previous cohorts, including the July 2024 cohort.
We can only speculate as to why the July 2025 SQE1 cohort was weaker – and why recent July cohorts have been weaker than the January cohorts of the same year. We do not collect data on whether candidates are sponsored, but we know that many of the larger law firms that sponsor candidates to take the SQE require them to take SQE1 in January. We expect this is likely to explain at least some of the difference between the January and the July SQE1 cohorts.
We can assure candidates that it does not matter in which sitting they are assessed – the same standard is applied for all sittings and all candidates, regardless of where or when they are assessed. For information on how the SQE1 standard setting process works, please see the video 'How the pass marks for SQE1 is set' which was originally delivered as part of the April 2025 SQE annual conference.
We do not prescribe how candidates prepare for their assessments. We do not regulate training providers that offer SQE courses or publishers that sell SQE materials.
There is a wide range of choices available to candidates – with different modes of delivery, different length and study and at different prices. Details are available on the SQE training provider page and a summary table is below.
SQE providers - matrix of cost, duration, class time and methods
Legend
Study timetable:
Delivery Mode
| Cost Range | On-demand | <1 mth | 2-5 mths | 6-10 mths | 11-15 mths | 16-24 mths |
|---|---|---|---|---|---|---|
| Free | ||||||
| £1-£1,000 | ||||||
| £1,001 to £2,000 | ||||||
| £2,001 to £3,000 | ||||||
| £3,001 to £4,000 | ||||||
| £4,001 to £5,000 | ||||||
| £5,001 to £6,000 | ||||||
| £6,001 to £7,000 | ||||||
| £7,001 to £8,000 | ||||||
| £8,001 to £9,000 | ||||||
| £9,001 to £10,000 | ||||||
| £10,001+ |
Some candidates prepare by taking more than one course or by buying materials, including mock assessments, to supplement a course and others study independently. Some take a course for SQE2 but not SQE1. We have published some case studies in which a number of candidates describe how they prepared for their assessments.
We want to publish information on the training market that is useful to candidates. What we publish must take account of a wide range of factors. It should also support a healthy training market. Any data we publish linking candidate performance with how those candidates prepared for their assessments must be contextualised. We will be exploring with external experts whether we can publish contextualised data that will be useful for candidates and will support a healthy market. There are additional ways by which we could provide useful information for candidates which we are working up.
Candidates have told us they would like the information we publish on training providers and course options to be searchable and to enable them to make comparisons. Our new course and training finder supports candidates in their search.
Solicitor apprentices must prepare for their assessments with a training provider approved by the Department for Education. It publishes achievement rates by provider training providers for Solicitor (level 7).
The statistical reports published after each sitting and the annual reports provide further data about the candidate cohorts and their performance, including on performance in the different practice areas assessed.
The annual reports include information on the reliability of the assessments and on the standard error of measurement. The measures show the assessments are functioning well. This is also confirmed in the SQE Independent Reviewer's reports.
The annual reports also include information on the number and nature of the reasonable adjustments made for disabled candidates – for the sittings taken during January-July 2024 reasonable adjustments were provided for 8-11% of candidates. Candidates who had a reasonable adjustment had significantly higher pass rates than candidates who did not have a reasonable adjustment in four of the seven sittings. There was no significant difference in pass rates for the other three sittings.
Feedback is collected from candidates after every sitting. There is a section at the end of each annual report that summarises the feedback received and the response to that feedback.
During summer 2025, SQE training providers and publishers of SQE preparation materials were invited to attend workshops explaining how SQE1 questions are written. These were attended by 113 individuals. Material covered in the workshops is summarised in a recording and a note on single best answer multiple choice questions in SQE1.
Kaplan published 50 new SQE1 sample questions at the end of 2025 – taking the total up to 220 questions. The new questions are split evenly between the two assessments (FLK1 and FLK2) and have been used in previous exam papers.
Kaplan has also published two new SQE2 sample questions adding to the previous eight. These include a written discussion of the answers, legal-point guidance and performance analysis in areas covering Wills, Probate and Business Organisations.
Next set of annual reports
The next set of annual reports, covering the academic year September 2024 – August 2025 will be published in the spring.